Redshift Table Design Playbook
Recently I published a 5 part content series to the AWS Big Data Blog titled: Amazon Redshift Engineering’s Advanced Table Design Playbook. In this series I discuss an in-depth methodology to approach table and column properties such as distribution keys, sort keys, compression encodings, etc.
My goal for the article was to simplify the process in determining which properties are ideal for a given table/column based on the actual workload. Rather than providing blanket guidance which only helps for the most straight-forward, common, use cases - I attempted to achieve this by providing flow charts that can be followed on a table-by-table or column-by-column basis.
A sample of these flow charts are below, links to my articles which help to explain the questions follow:
Flow charts:
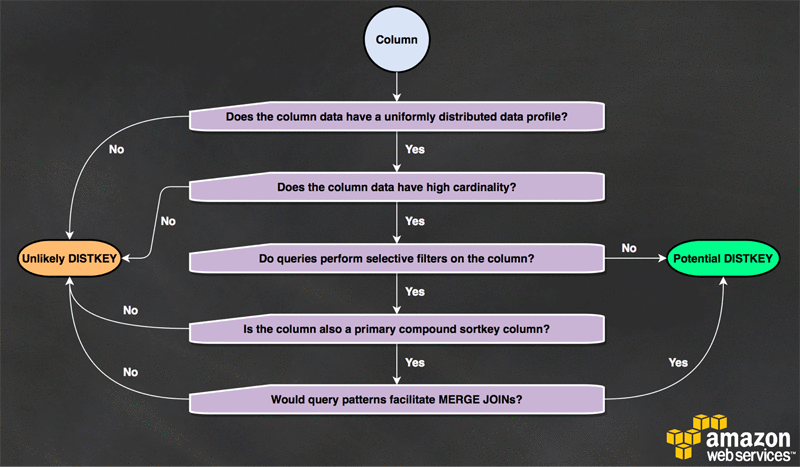
Is a column an appropriate distribution key?
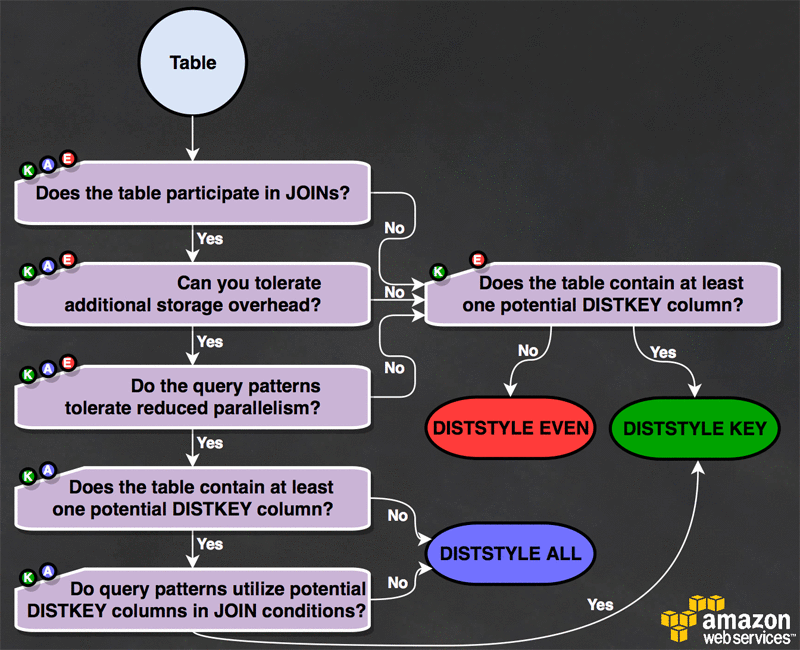
What DISTSTYLE should my table be?
Will sorting this table benefit my workload?
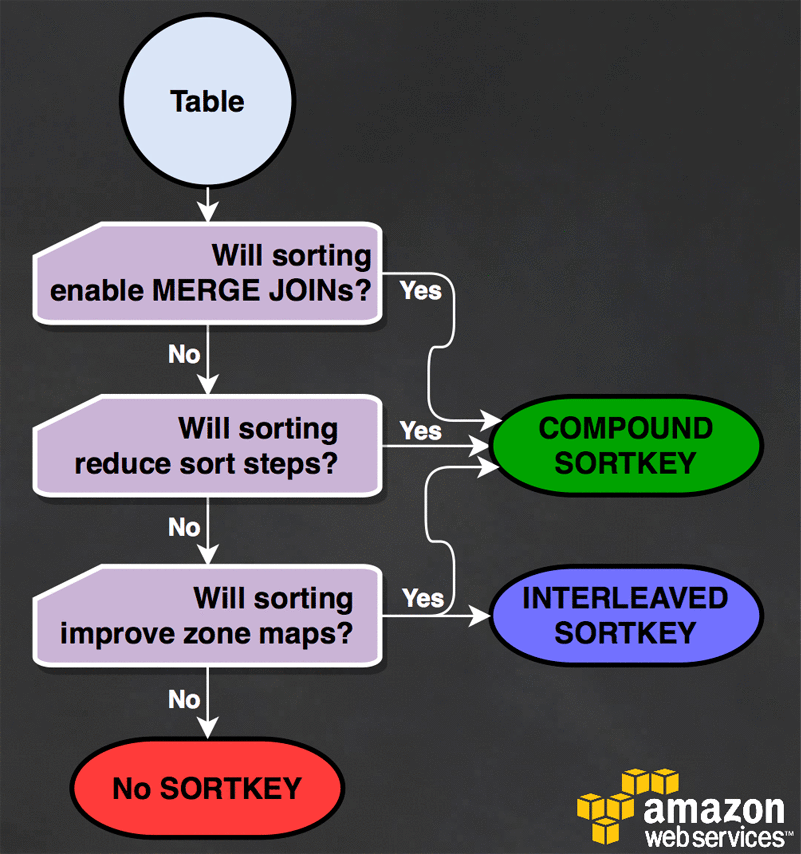
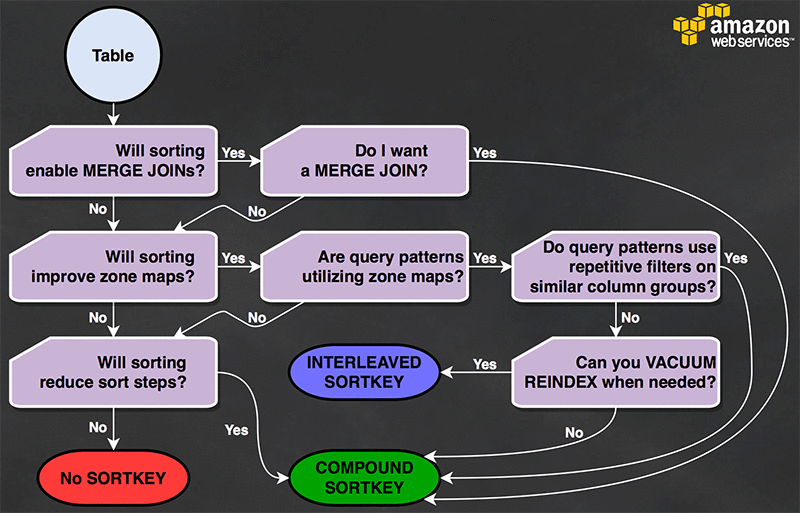
What sort style should this table use?
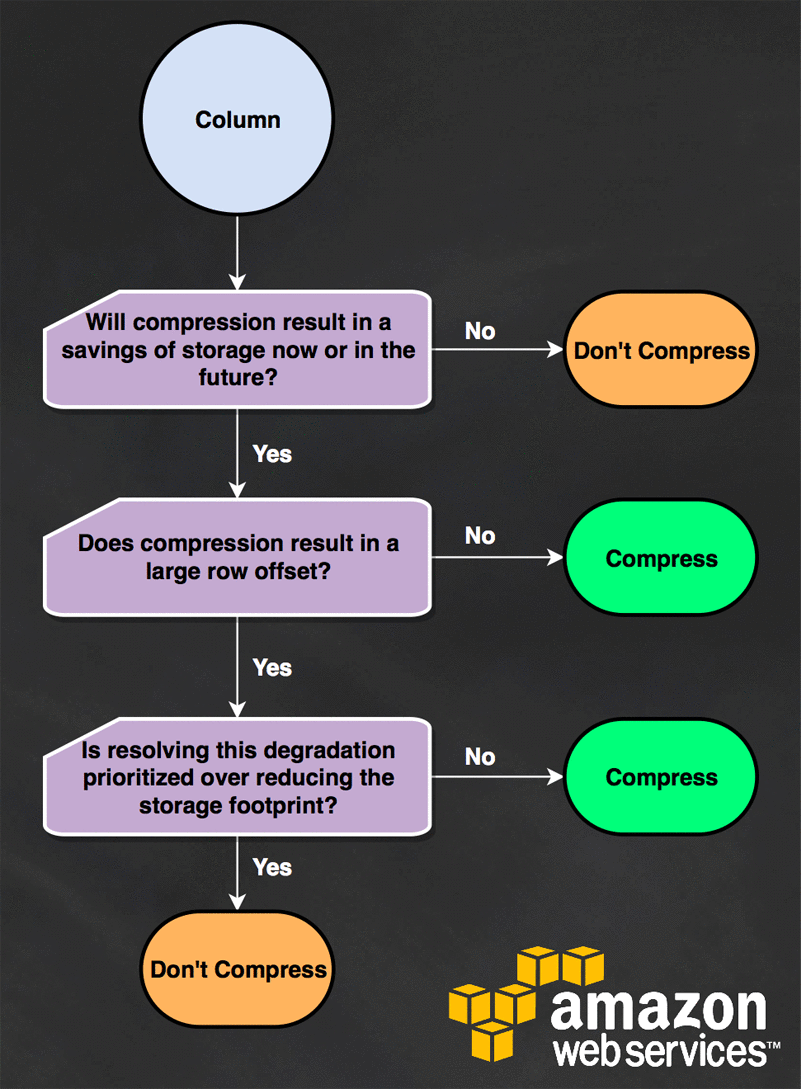
Will compressing this column benefit my workload?
Articles:
Part 1: Preamble, Prerequisites, and Prioritization
Part 2: Distribution Styles and Distribution Keys
Part 3: Compound and Interleaved Sort Keys
Feedback
Although not specifically related to the Apache Hadoop™ ecosystem. They referenced this Redshift specific series in Hadoop Weekly #196.
As always, let me know if you have any comments or feedback.